Direct answer: instrument traces first, then evaluations, then production monitors
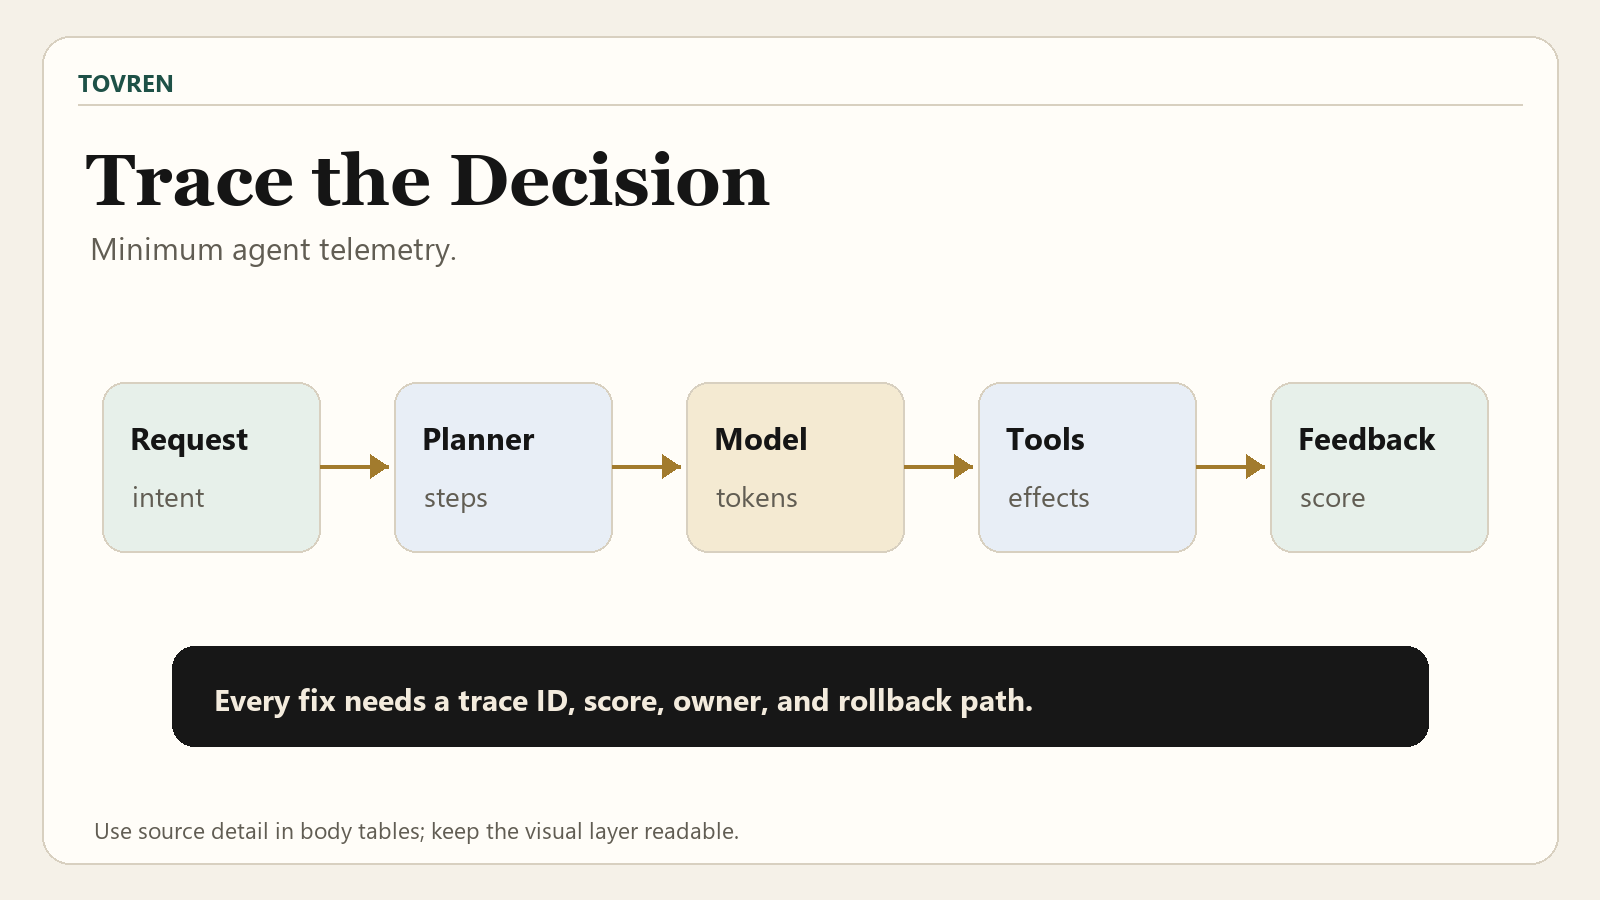
The practical agent observability stack should start with step-level traces. Before a team argues about dashboards, eval suites, or incident workflows, it needs a durable record of what the agent did: the user request, planner step, model call, tool invocation, retrieval call, MCP interaction, agent handoff, downstream system effect, latency, cost, error, and final response.
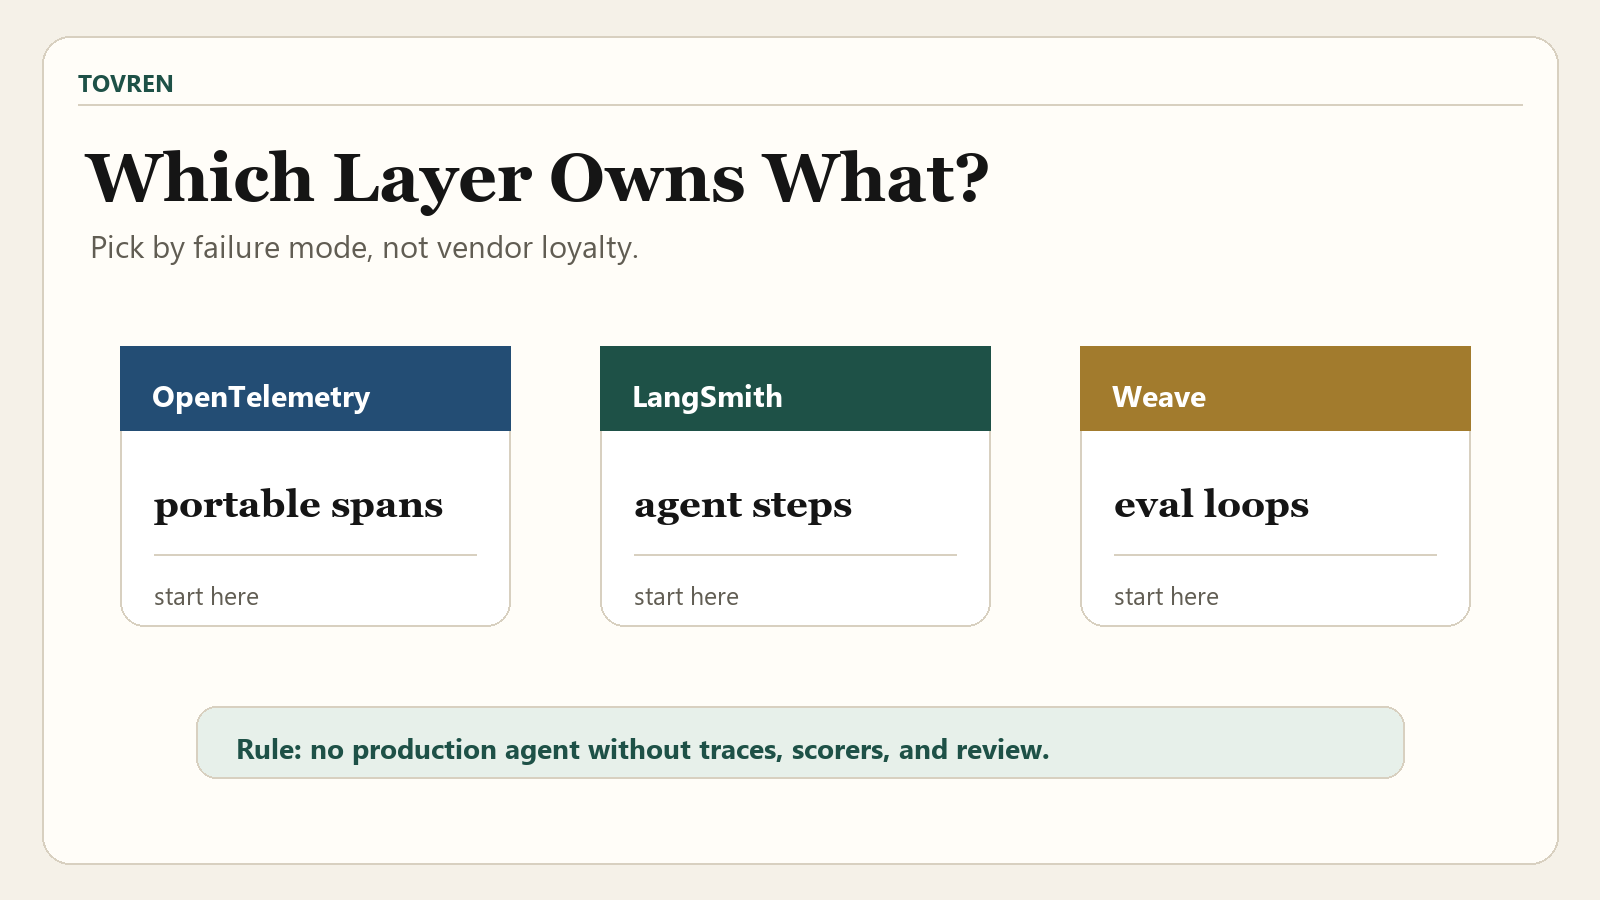
Use OpenTelemetry as the portable instrumentation layer where you need vendor-neutral traces and standard attributes. Use LangSmith when your team is building with LangChain or LangGraph and wants fast tracing, monitoring, cost and latency tracking, response quality monitoring, and visibility into each agent step. Use W&B Weave when the priority is the improvement loop: traces, evaluations, versioning, feedback, production monitoring, and regression prevention for LLM applications and agent workflows.
The minimum viable stack is simple: capture every agent step with stable IDs, log every model and tool call, attach feedback and evaluation results to traces, monitor production traffic with passive scoring, and review failures weekly. Do not ship an agent that cannot answer: “What did it do, why did it do it, what changed, how much did it cost, and did the fix prevent the same failure from returning?”
TLDR
- First priority: trace every LLM call, tool invocation, agent handoff, MCP call, and downstream system impact before optimizing dashboards.
- Best default architecture: OpenTelemetry for portable semantic instrumentation, LangSmith for LangChain/LangGraph debugging and production monitoring, and Weave for evaluation-driven improvement loops.
- What to monitor: task success, tool errors, hallucination risk, latency, cost, model changes, prompt changes, retrieval quality, handoff failures, and regression against known cases.
- What to avoid: only logging final answers, treating evals as a launch-time test, ignoring MCP/tool calls, or failing to connect production incidents back to prompts, traces, datasets, and versions.
Why agent observability is now different from chatbot logging
A chatbot observability setup can often get by with prompt, completion, token usage, latency, and a few quality scores. An agent observability stack needs more structure because the system is taking multiple steps, calling tools, handing off work, and touching external systems.
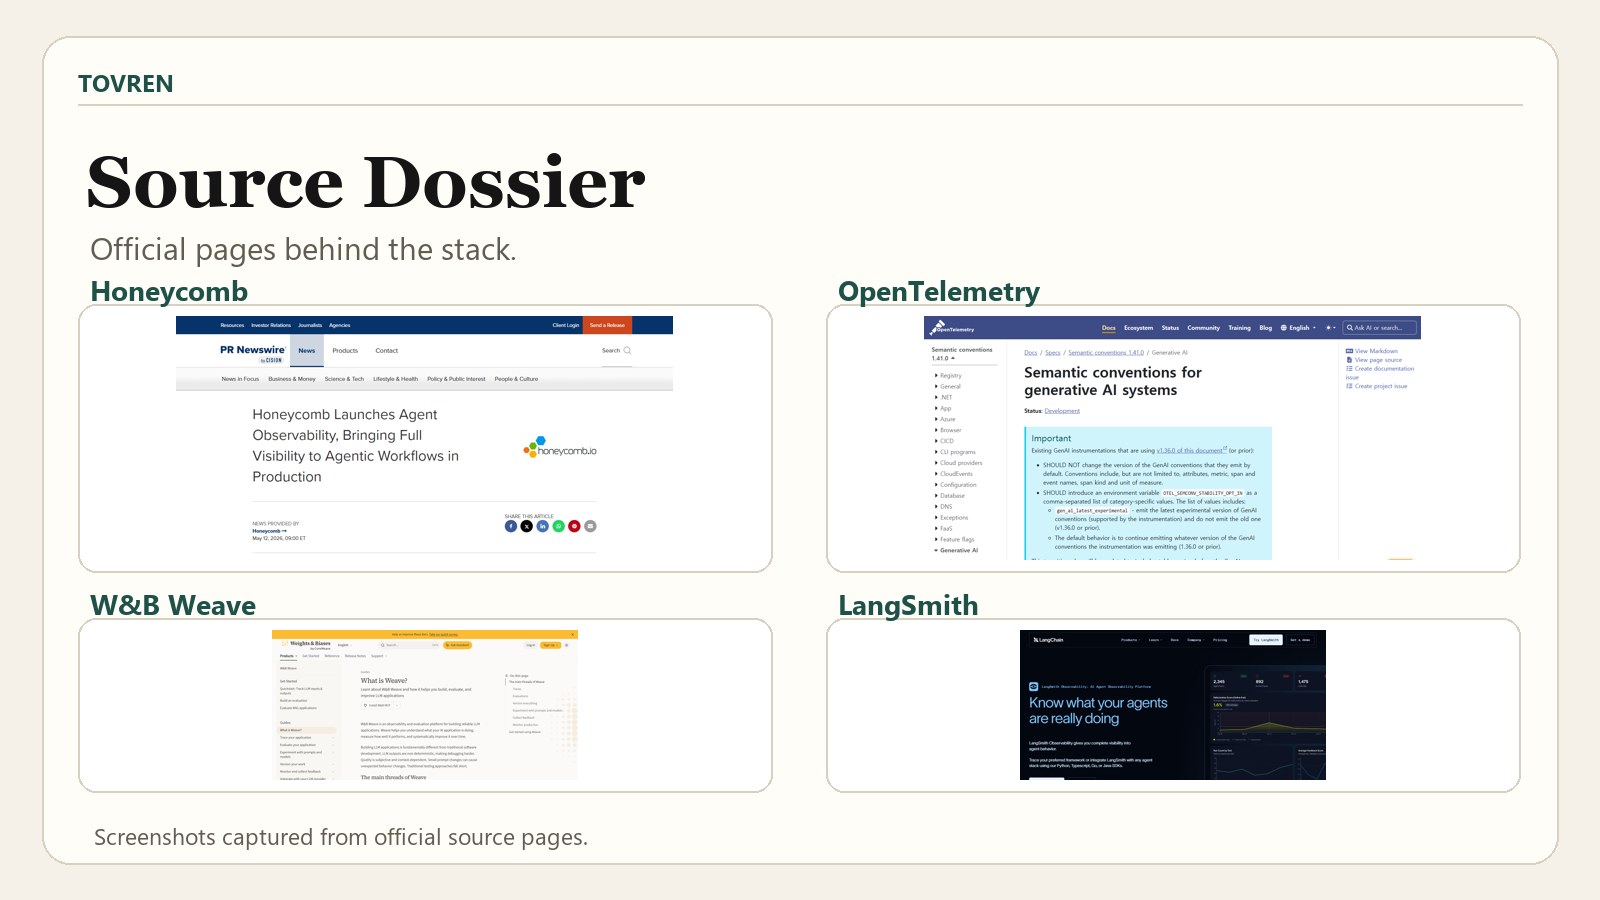
Honeycomb’s May 12, 2026 Agent Observability announcement framed the production requirement clearly: teams need to trace every LLM call, tool invocation, agent handoff, and downstream system impact. That is the right starting point for any team moving from demos to deployed agents.
CoreWeave’s May 28, 2026 announcement around unified agentic AI capabilities points in the same direction from the training-to-inference side. It describes W&B Weave as the observability layer for the loop between production behavior and agent improvement, with production monitoring, built-in and custom signals, a multi-agent workflow data model, and evaluations to prevent regressions.
The operating lesson is direct: agent observability is not a screenshot of a chat transcript. It is a connected evidence chain from production behavior to debugging, evaluation, regression prevention, and model or workflow improvement.
Tool-selection matrix: Weave vs LangSmith vs OpenTelemetry
Most teams should not treat these as identical products. They sit at different layers of the agent observability stack.
| Layer | Best fit | Use it when | Primary value | Watch out for |
|---|---|---|---|---|
| OpenTelemetry GenAI semantic conventions | Portable instrumentation standard | You need vendor-neutral traces, attributes, metrics, model spans, agent spans, events, exceptions, or MCP-related telemetry. | Creates a shared telemetry language across agents, models, tools, and observability backends. | The GenAI conventions are in Development. Older instrumentation using v1.36.0 or prior should not change defaults automatically; opt in to the latest experimental conventions only when the team is ready. |
| LangSmith Observability | Agent and LLM app observability for LangChain/LangGraph teams | You want tracing, real-time monitoring, alerting, usage insights, cost tracking, latency tracking, response quality monitoring, and visibility into each agent step. | Fast practical debugging and production visibility for agent applications, especially when the app already uses the LangChain ecosystem. | Do not let framework convenience replace a durable schema for IDs, versions, tools, prompts, datasets, and incidents. |
| W&B Weave | Evaluation and improvement loop | You need traces, evaluations, versioning, feedback, production monitoring, passive scoring of production traffic, and regression prevention. | Connects production behavior to evals, feedback, monitoring signals, and agent improvement. | Monitors are only useful if the scoring logic reflects real failures. Start with a small set of high-confidence signals. |
| Honeycomb Agent Observability | Production observability for agentic workflows | You need timeline-style investigation, canvas-style workflow analysis, and OpenTelemetry GenAI attribute support across agent workflows. | Broad production visibility across LLM calls, tool executions, MCP calls, model evaluations, agents, and downstream effects. | Teams still need disciplined instrumentation and ownership. A strong backend cannot fix missing events. |
The cleanest decision rule: OpenTelemetry standardizes the signals, LangSmith accelerates agent debugging, and Weave closes the evaluation and improvement loop.
What to instrument first
Do not start by trying to instrument everything. Start with the events needed to debug failed user tasks and prevent repeated regressions.
| Priority | Signal to capture | Why it matters | Minimum fields | Useful destination |
|---|---|---|---|---|
| 1 | Trace ID and session ID | Connects the user’s request to every model call, tool call, handoff, error, and final result. | trace_id, session_id, user_request_id, environment, timestamp | OpenTelemetry, LangSmith, Weave |
| 2 | Agent step spans | Shows what the agent planned, attempted, skipped, retried, or delegated. | agent_name, step_name, parent_span_id, decision_summary, status | OpenTelemetry agent spans, LangSmith traces, Weave traces |
| 3 | LLM calls | Needed to debug quality, latency, cost, model drift, and prompt failures. | model, provider, prompt_version, input_hash, output_hash, token_usage, latency_ms, cost_estimate | LangSmith, Weave, OpenTelemetry GenAI model spans |
| 4 | Tool invocations and MCP calls | Agents often fail at the boundary between reasoning and action. | tool_name, tool_version, arguments_schema_version, success, error_type, response_summary, downstream_system | OpenTelemetry GenAI conventions, Honeycomb, LangSmith, Weave |
| 5 | Agent handoffs | Multi-agent systems fail when context is lost or responsibility is unclear. | source_agent, target_agent, handoff_reason, context_payload_hash, accepted_status | Weave multi-agent workflow model, OpenTelemetry agent spans, LangSmith traces |
| 6 | Evaluation and feedback results | Turns production behavior into measurable improvement and regression protection. | eval_name, score, threshold, evaluator_version, feedback_type, linked_trace_id | Weave evaluations, Weave feedback, LangSmith monitoring |
| 7 | Production monitors | Surfaces trends and issues without requiring every trace to be manually reviewed. | monitor_name, scoring_result, sample_rate, trigger_reason, linked_trace_id | Weave monitors, LangSmith alerts, Honeycomb workflows |
Recommended instrumentation schema
The schema below is intentionally practical. It is not a full standard. It is a working application-level layer that can map into OpenTelemetry GenAI semantic conventions and still remain readable in LangSmith, Weave, or a production observability backend.
| Entity | Required attributes | Optional attributes | Failure question it answers |
|---|---|---|---|
| Request | trace_id, request_id, session_id, user_intent, environment, release_version | customer_segment, region, channel, risk_class | Which user task failed, in which release, and under which environment? |
| Agent | agent_name, agent_version, step_name, parent_span_id, status | policy_version, autonomy_level, fallback_mode | Which agent step caused the task to fail or stall? |
| Model call | provider, model, prompt_version, input_hash, output_hash, latency_ms, token_usage | temperature, max_tokens, tool_choice, cost_estimate | Was the issue caused by model behavior, prompt changes, latency, or cost? |
| Tool call | tool_name, tool_version, arguments_hash, success, error_type, latency_ms | retry_count, permission_scope, sandbox_status, downstream_system | Did the agent fail because a tool, API, credential, permission, or downstream system failed? |
| MCP interaction | server_name, server_version, method, status, latency_ms | resource_type, auth_mode, policy_decision, error_message_hash | Did the failure occur at the MCP boundary? |
| Handoff | source_agent, target_agent, handoff_reason, context_payload_hash, accepted_status | handoff_policy_version, missing_context_flags | Did a multi-agent workflow lose context or assign work incorrectly? |
| Evaluation | eval_name, evaluator_version, score, threshold, pass_fail, linked_trace_id | golden_case_id, rubric_version, human_review_status | Did the change improve the agent or reintroduce a known failure? |
| Monitor | monitor_name, scoring_result, severity, linked_trace_id, created_at | sample_rate, alert_channel, owner, incident_id | Which production trend deserves investigation now? |
A practical stack pattern
A reliable agent observability stack usually has four layers:
- Instrumentation layer: capture traces and attributes as close to the agent runtime as possible. Use OpenTelemetry-compatible semantics where portability matters.
- Debugging layer: inspect traces, agent steps, model calls, tool calls, handoffs, and latency. LangSmith is a strong fit when the app is built with LangChain or LangGraph.
- Evaluation layer: score representative traces and test cases against quality, safety, task success, and regression criteria. Weave is a strong fit for tying traces, evaluations, versioning, and feedback together.
- Production monitoring layer: passively score production traffic, watch trends, alert on regressions, and feed reviewed failures back into eval datasets. Weave monitors are designed for passive scoring of production traffic and store scoring results in Weave feedback.
This is also where governance and security should connect. If the agent uses MCP servers, credentials, tunnels, or external tools, pair observability with a credential and sandbox review. Tovren’s related guide on AI agent credential security, MCP tunnels, sandboxing, and audit controls is the natural companion to this setup.
Implementation checklist
Use this checklist before a production agent launch. The goal is not to create a perfect observability platform. The goal is to make the first serious failure diagnosable.
| Checklist item | Owner | Done when | Evidence to keep |
|---|---|---|---|
| Define trace boundaries | Engineering | Every user task has one trace ID across model calls, tool calls, handoffs, and final response. | Sample trace showing full request path |
| Version prompts, tools, and agents | Engineering and product | Every trace records release version, prompt version, agent version, and tool version. | Trace with version fields populated |
| Instrument model calls | Engineering | Provider, model, latency, token usage, prompt version, and output status are visible. | LLM span or trace detail |
| Instrument tool calls and MCP calls | Engineering and security | Tool name, version, arguments hash, success, error type, latency, and downstream system are captured. | Tool-call trace with success and failure examples |
| Create a small eval set | Product and QA | At least 20 to 50 representative cases cover common tasks and known failure modes. | Eval dataset with owner and update date |
| Add production monitors | Engineering and operations | Passive scoring tracks high-value signals such as failed task completion, unsafe tool use, bad handoff, or cost spikes. | Monitor definitions and sample results |
| Connect alerts to review workflow | Operations | Critical monitor failures create review work with linked trace IDs and owner. | Alert example linked to trace and remediation note |
| Create regression gate | Engineering and QA | Known failure cases must pass before prompt, tool, or agent release changes are shipped. | Pre-release eval report |
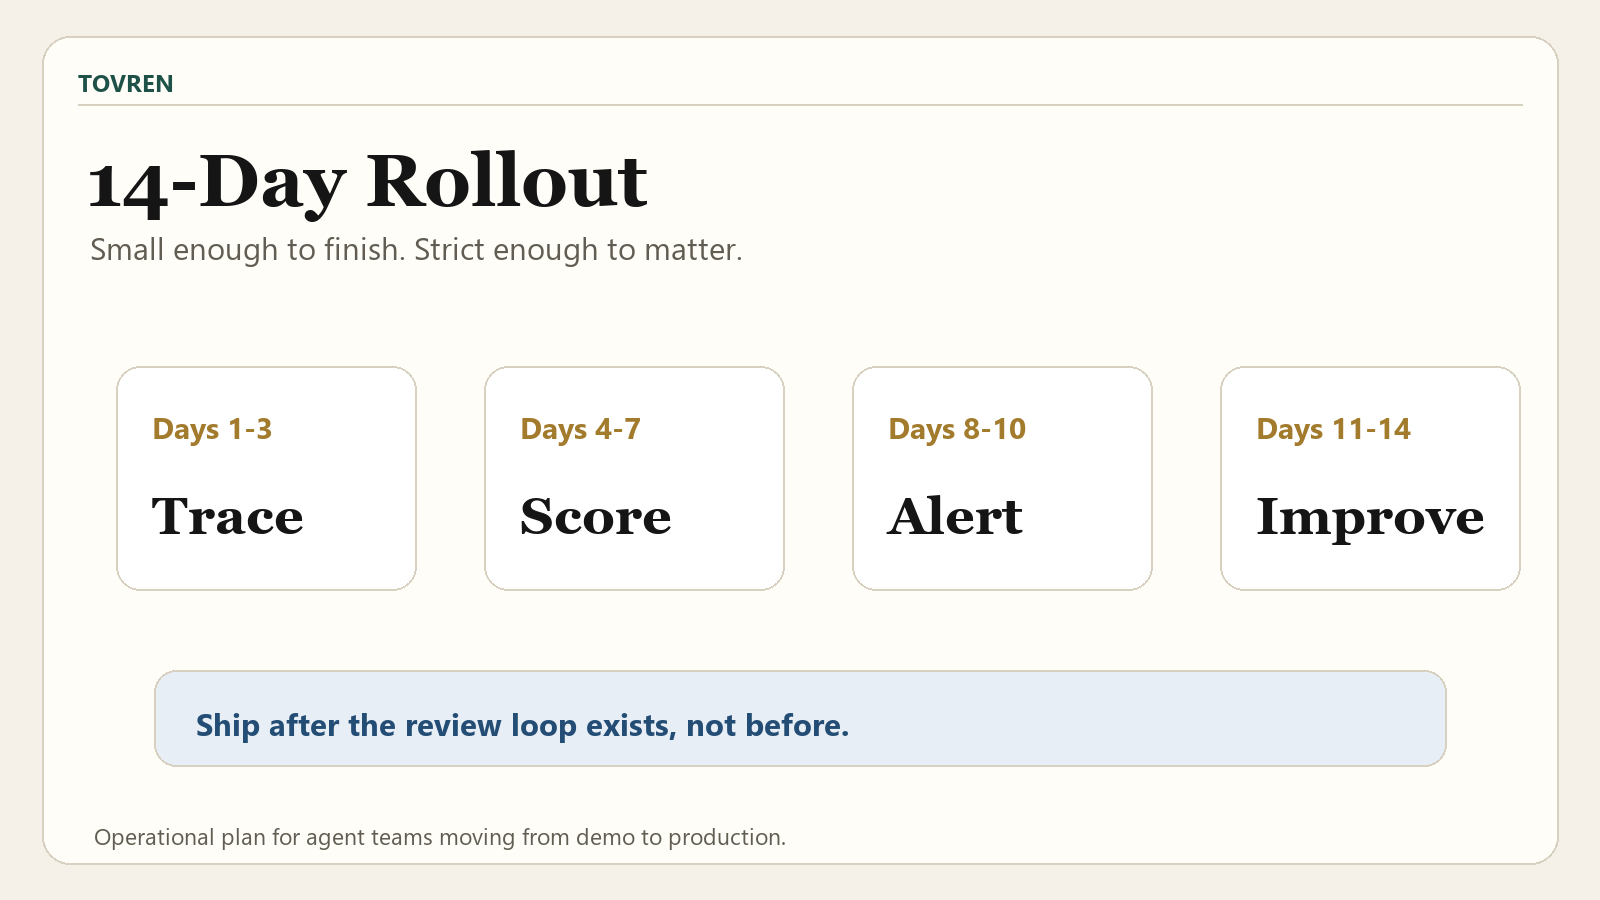
14-day rollout plan
This plan assumes one production-bound agent, a small engineering team, and a business owner who can define acceptable task outcomes. Compress or extend it based on risk.
| Day | Workstream | Action | Output |
|---|---|---|---|
| 1 | Scope | Pick one agent workflow and define the top five failure modes. | Failure-mode list with business owner approval |
| 2 | Schema | Define trace IDs, request IDs, agent versions, prompt versions, tool versions, and evaluation fields. | Telemetry schema v0.1 |
| 3 | Instrumentation | Add spans for request, agent step, LLM call, tool call, MCP call, and handoff. | End-to-end trace in staging |
| 4 | OpenTelemetry alignment | Map model, agent, exception, metrics, events, and MCP-related fields to OpenTelemetry GenAI conventions where appropriate. | Mapping document and sample trace |
| 5 | LangSmith or debugging view | Verify real-time trace inspection, latency tracking, cost tracking, and visibility into each agent step. | Debug dashboard with successful and failed traces |
| 6 | Weave or evaluation view | Connect traces to evaluations, versioning, feedback, and production monitoring design. | Evaluation workspace and trace-linked feedback path |
| 7 | Eval set | Create first 20 to 50 cases covering routine tasks, edge cases, and known bad outcomes. | Initial eval dataset |
| 8 | Monitor design | Define passive production scoring for task success, tool errors, unsafe actions, latency, and cost outliers. | Monitor definitions with thresholds |
| 9 | Staging test | Run synthetic and human-reviewed test traffic through the instrumented agent. | Trace review with failure notes |
| 10 | Regression gate | Require eval pass before prompt, tool, model, or agent-version changes. | Release checklist with eval gate |
| 11 | Incident workflow | Define who reviews monitor failures, how traces are triaged, and how fixes become eval cases. | Incident playbook |
| 12 | Security review | Review credentials, tool permissions, MCP access, sandboxing, and audit logs. | Security sign-off or risk register |
| 13 | Limited production | Launch to a small traffic segment with production monitoring enabled. | First production traces and monitor results |
| 14 | Review | Hold a trace review: top failures, top costs, slowest paths, failed tools, and eval gaps. | Improvement backlog for the next release |
How Weave fits the improvement loop
W&B Weave is positioned as an observability and evaluation platform for building reliable LLM applications. Its docs cover traces, evaluations, versioning, feedback, and production monitoring. That combination matters because deployed agents need a closed loop, not just a debugging UI.
The CoreWeave announcement adds an agent-specific direction: Weave is described as the observability layer for the loop between production behavior and agent improvement. The announced capabilities include production monitoring with built-in and custom signals, a multi-agent workflow data model, and evaluations to prevent regressions.
In practical terms, use Weave when the team needs to answer:
- Which production traces should become evaluation cases?
- Which prompt, tool, model, or agent version introduced the regression?
- Which monitor caught the issue, and what feedback was attached?
- Did the fix actually prevent the same failure from returning?
For deeper governance design, see Tovren’s guide to AI agent evaluations and runtime governance.
How LangSmith fits agent debugging
LangSmith Observability is useful when teams need a fast operational view into agent behavior. The stated capabilities include tracing, real-time monitoring, alerting, usage insights, cost and latency tracking, response quality monitoring, and visibility into each agent step.
That makes it a strong fit for teams building with LangChain or LangGraph that need to debug why an agent selected a tool, why a call was slow, why cost increased, or why a response failed a quality check.
The main operating caution is to avoid using any single tool as a substitute for instrumentation discipline. Even the best trace viewer is weak if traces do not include stable IDs, prompt versions, model versions, tool versions, handoff details, and linked evaluation results.
How OpenTelemetry fits portability
OpenTelemetry GenAI semantic conventions are the right place to look when a team wants standardized telemetry for generative AI systems. The GenAI conventions define signals for events, exceptions, metrics, model spans, agent spans, and MCP.
The important caveat is stability. The OpenTelemetry GenAI semantic conventions page says the conventions are in Development. It also says instrumentations using older v1.36.0 or prior should not change defaults and can opt into the latest experimental conventions with OTEL_SEMCONV_STABILITY_OPT_IN=gen_ai_latest_experimental.
That matters for production teams. Use OpenTelemetry to reduce lock-in and keep the agent telemetry model portable, but treat the GenAI conventions as an evolving layer. Version your schema and document which semantic convention behavior your runtime uses.
Mistakes to avoid
| Mistake | Why it breaks production debugging | Fix |
|---|---|---|
| Only logging final answers | You cannot reconstruct the model calls, tool calls, handoffs, or errors that produced the answer. | Capture step-level traces from request to final response. |
| Skipping tool and MCP telemetry | Many agent failures happen at the action boundary, not in the final text. | Instrument tool name, version, arguments hash, status, latency, permissions, and downstream system. |
| No prompt, model, or agent versioning | Regression analysis becomes guesswork after a release. | Record release version, prompt version, model, agent version, and tool version on every trace. |
| Running evals only before launch | Production failures never become regression tests. | Convert reviewed failures into eval cases and gate future releases against them. |
| Using monitors without owners | Alerts become noise when nobody owns review and remediation. | Assign monitor owners, severity rules, and trace-review workflows. |
| Ignoring downstream system impact | The agent can appear successful while causing failures in CRM, billing, support, data, or workflow systems. | Capture downstream system status and link agent traces to external effects. |
What a good first dashboard should show
The first dashboard should not be a vanity board. It should help the team decide what to fix this week.
- Failed task rate by agent version and workflow.
- Tool error rate by tool name, version, and downstream system.
- Latency by model call, tool call, and full workflow.
- Cost by user task, agent version, model, and retry count.
- Evaluation pass rate by release, prompt version, and known failure class.
- Monitor-triggered traces grouped by severity and owner.
- Top recurring failure modes converted into regression cases.
Teams building coding agents should also watch model/tool iteration loops closely. For a related comparison of coding-agent capabilities, see Tovren’s Claude Opus 4.8 vs GPT-5.5 coding agents analysis and the AGENTS.md prompt pack for Copilot, Claude, Gemini, and coding agents.
Recommended stack by team type
| Team type | Recommended starting stack | Why | First success metric |
|---|---|---|---|
| LangChain or LangGraph builder team | LangSmith plus OpenTelemetry mapping | Fast visibility into each agent step, with a path to portable telemetry. | Every failed task has a readable trace with model, tool, latency, and cost details. |
| Business team piloting an agent workflow | LangSmith or Weave, depending on implementation | The team needs practical debugging, quality review, and a small eval set before scaling. | Top five production failure modes are visible and reviewed weekly. |
| AI platform team supporting multiple frameworks | OpenTelemetry-first with backend integrations | Portability matters when agents, tools, and model providers vary across teams. | Common schema adopted across production agent services. |
| Evaluation-heavy product team | Weave plus production monitors | The team needs traces, evaluations, feedback, versioning, and regression prevention in one improvement loop. | Production failures become eval cases and release gates. |
| Operations-heavy production team | OpenTelemetry plus Honeycomb-style production observability | Timeline investigation and broad production visibility are important when agents touch downstream systems. | LLM calls, tool invocations, handoffs, MCP calls, and downstream impacts are traceable. |
Publishing verdict
For most teams, the right agent observability stack is not a single product decision. It is an instrumentation sequence:
- Trace first: capture every agent step, LLM call, tool invocation, MCP call, handoff, and downstream impact.
- Standardize second: map the important fields into OpenTelemetry GenAI semantic conventions where portability matters.
- Debug third: use LangSmith or a similar agent observability layer to inspect traces, costs, latency, alerts, quality, and step-level behavior.
- Improve continuously: use Weave or an equivalent evaluation and monitoring workflow to turn production behavior into feedback, eval cases, monitors, and regression gates.
The business risk is not that the team chooses the wrong dashboard. The bigger risk is shipping an agent that makes decisions, calls tools, hands off work, and changes downstream systems without leaving enough evidence to debug or improve it.
For teams comparing agent performance claims, pair this observability setup with a benchmark review process. Tovren’s AI agent benchmark audit guide explains how to treat benchmark claims more skeptically before turning them into product decisions.
FAQ
What is an agent observability stack?
An agent observability stack is the instrumentation, tracing, monitoring, evaluation, and feedback system used to understand how an AI agent behaves in production. It should capture model calls, tool calls, agent steps, handoffs, MCP interactions, downstream system effects, errors, costs, latency, and evaluation results.
Should we start with Weave, LangSmith, or OpenTelemetry?
Start with the layer that matches your immediate bottleneck. Use OpenTelemetry when portability and standard telemetry matter. Use LangSmith when you need fast agent debugging and step-level visibility, especially in LangChain or LangGraph applications. Use Weave when evaluations, feedback, production monitoring, versioning, and regression prevention are the priority.
What should we instrument before launch?
Before launch, instrument trace IDs, session IDs, agent steps, LLM calls, tool calls, MCP calls, handoffs, errors, latency, cost, prompt versions, model versions, tool versions, and evaluation results. At minimum, a failed production task should be explainable from request to final response.
Are OpenTelemetry GenAI semantic conventions stable?
The OpenTelemetry GenAI semantic conventions page says the conventions are in Development. It also says instrumentation using v1.36.0 or prior should not change defaults and can opt into the latest experimental conventions with OTEL_SEMCONV_STABILITY_OPT_IN=gen_ai_latest_experimental.
How do production monitors help agent teams?
Production monitors help teams passively score real traffic, surface trends and issues, and attach scoring results to feedback or review workflows. In Weave, monitors passively score production traffic and store scoring results in Weave feedback, which helps teams turn incidents into improvement and regression-prevention work.
Source log
- CoreWeave investor news, May 28, 2026: Used for claims about unified agentic AI capabilities, W&B Weave as the observability layer for production behavior and agent improvement, production monitoring, built-in and custom signals, multi-agent workflow data model, evaluations to prevent regressions, W&B Skills, and MCP server. URL: https://investors.coreweave.com/news/news-details/2026/CoreWeave-Closes-the-Training-to-Inference-Gap-for-Autonomous-Agent-Improvement/default.aspx
- Honeycomb PR Newswire announcement, May 12, 2026: Used for claims about Agent Observability, Agent Timeline, Canvas Agent, Skills, the need to trace every LLM call, tool invocation, agent handoff, and downstream system impact, and OpenTelemetry GenAI semantic conventions v1.40.0 integration. URL: https://www.prnewswire.com/news-releases/honeycomb-launches-agent-observability-bringing-full-visibility-to-agentic-workflows-in-production-302769398.html
- OpenTelemetry GenAI semantic conventions: Used for claims that GenAI conventions are in Development and define signals for events, exceptions, metrics, model spans, agent spans, and MCP, plus the opt-in behavior for latest experimental conventions. URL: https://opentelemetry.io/docs/specs/semconv/gen-ai/
- LangSmith Observability: Used for claims about tracing, real-time monitoring, alerting, usage insights, cost and latency tracking, response quality monitoring, and visibility into each agent step. URL: https://info.langchain.com/AI-Observability
- W&B Weave tracking docs: Used for claims that Weave is an observability and evaluation platform for reliable LLM applications covering traces, evaluations, versioning, feedback, and production monitoring. URL: https://docs.wandb.ai/weave/guides/tracking
- W&B Weave monitors docs: Used for claims that monitors passively score production traffic to surface trends and issues and store scoring results in Weave feedback. URL: https://docs.wandb.ai/weave/guides/evaluation/guardrails_and_monitors/
WordPress checklist and refresh triggers
- Primary category: Automation & Agents.
- Slug: agent-observability-stack-weave-langsmith-opentelemetry.
- Focus keyword: agent observability stack.
- Internal links included: AI agent evaluations and runtime governance; AI agent credential security; Claude Opus 4.8 vs GPT-5.5 coding agents; AGENTS.md prompt pack; AI agent benchmark audit.
- Schema: Use the FAQ JSON-LD supplied below.
- Image QA: Confirm TOVREN masthead, 16:9 crop, low text, official-source screenshot panels, custom diagram, no dense labels, and no text touching boxes.
- Refresh trigger: Update when OpenTelemetry GenAI semantic conventions move from Development, when LangSmith or Weave changes observability capabilities, when Honeycomb updates Agent Observability support, or when CoreWeave/W&B changes Weave agent workflow features.
- Fact-check note: This package uses only the verified source facts supplied in the prompt and does not quote pricing, benchmark results, or availability claims not present in those facts.